High Availability ML Deployments
9 October, 2022

The average cost of IT downtime is $5,600 per minute.
~ Gartner
Downtimes can be costly. During downtimes, a company may face loss of business, loss of customer trust, loss of reputation in the technical and business community, or even all of these together. Downtimes are not fun, and until it happens to us, we all tend to think it cannot happen to us.

What makes the challenge more difficult is the fact that the world is rapidly incorporating more and more Machine learning on the web, and this has led to complexities that did not exist with non-ML software solutions.
In this blog, we'll be exploring how to design a machine learning based solution that is highly reliable and does not suffer much when downtimes occur.
In this 2 part article, we’ll try to find answers to the following questions:
How quickly can your system bounce back from disasters?
Are your ML deployments resilient?
When can you call your system architecture “high availability”?
Part 1 - Undestanding HADR systems
Let us begin by understanding a few basics of High Availability Disaster Recovery (HADR) systems. We'll cover a few key terms and then some common system topologies.
Key terms related to HADR systems
Key terms that you should know about HADR systems -
High Availability
High availability (HA) describes the ability of an application to withstand all planned and unplanned outages (a planned outage could be performing a system upgrade) and to provide continuous processing for business-critical applications.
Disaster Recovery
Disaster recovery (DR) involves a set of policies, tools, and procedures for returning a system, an application, or an entire data center to full operation after a catastrophic interruption. It includes procedures for copying and storing an installed system's essential data in a secure location, and for recovering that data to restore normalcy of operation.
Unplanned downtime
Downtime caused by factors which were not introduced on purpose is called unplanned downtime. This can be majorly due to:
Human Error
Software Problems
Hardware Failure
Environmental Issues

Planned downtime
The opposite of unplanned downtime.

Downtimes introduced on purpose, mostly are:
System upgrades
System repairs
Restricted access due to business reasons
Chaos Engineering
Chaos engineering is a method of testing distributed software that deliberately introduces failure and faulty scenarios to verify its resilience in the face of random disruptions. These disruptions can cause applications to respond in unpredictable ways and can break under pressure.
Resilience
The ability of a solution to absorb the impact of a problem in one or more parts of a system, while continuing to provide an acceptable service level to the business customers.
Key metrics for analyzing your system design
The key metrics used to analyze system designs are -
Production capacity in and out of region
Platform availability
Availability during planned outages
Failure Impact
Disaster recovery time
Incident response time
Next, let's look at some HADR system topologies, before we compare their metrics.
A 30,000ft view of high availability system design
HADR systems can be designed with several topologies ranging from simple ones - where you put all your eggs in a single basket - or complex ones - where you devise a fail-safe array of servers. Let us study a couple of them to understand how such topologies look like -
Consider the following 2-Active topology -
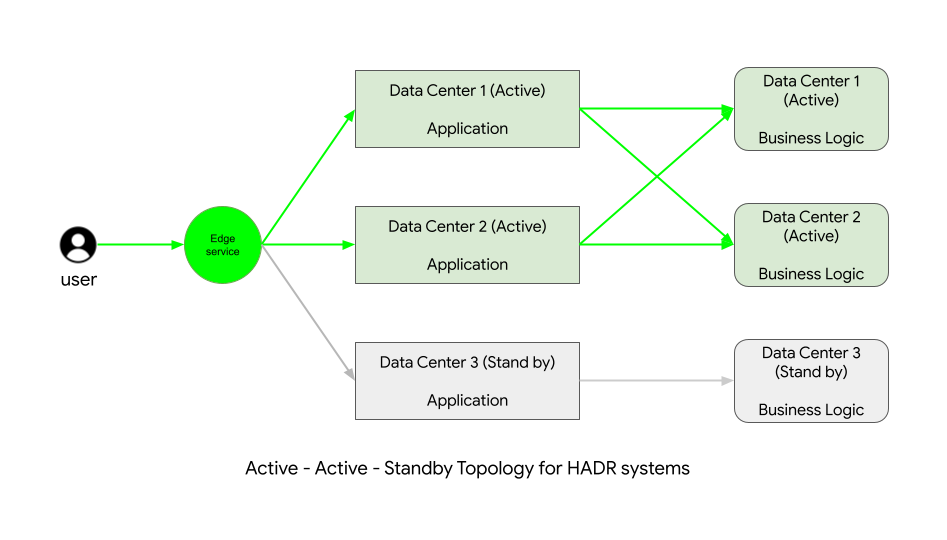
This topology shows that we provision 3 servers such that during normal operations, 2 servers load balance the traffic coming to the application while a third server stays on standby. This server gets activated in the event of failure of any or all of the active servers.
An alternative to a 2-Active system topology is a 3-Active topology -
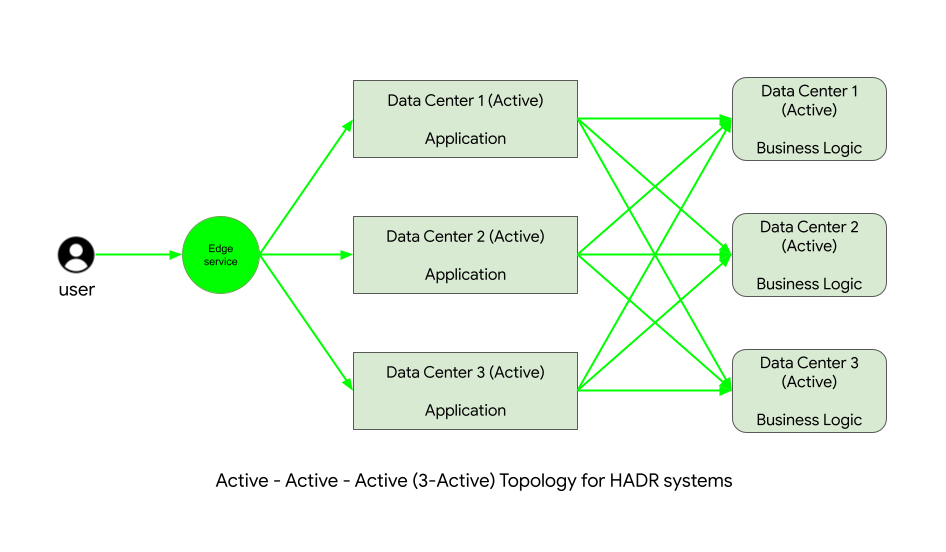
In this system topology, we provision all three servers as active servers and in event of failure of any server, the other servers load balance the traffic, while the failed servers are brought back up.
An obvious question here - which of these is better?
Consider the following chart of metrics comparison for the above two systems against a single Active system -
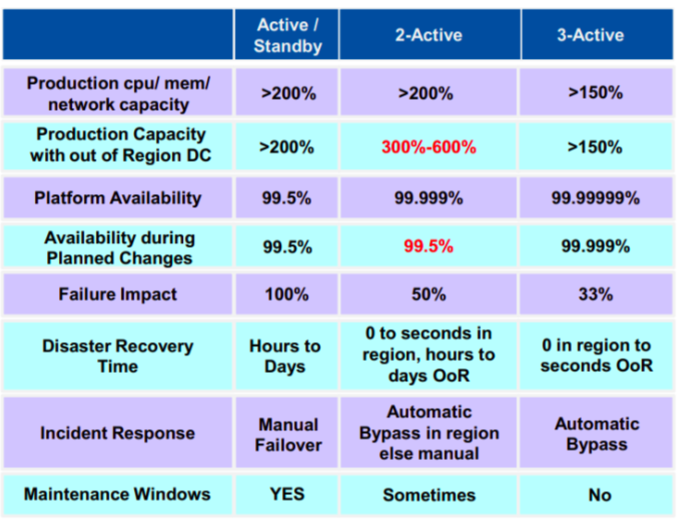
From the above, it can be said that while 3-active systems gives highest availability and lowest failure impacts, if your application is likely to expect surges, a 2-active system might give you better resilience.
We shall wrap our discussion about HADR system topologies here. Next, we'll talk about challenges posed by ML in HADR systems and see a demo of these topologies in action!
Part 2 - HADR system challenges by ML deployments and load testing ML-HADR system
Machine Learning heavy deployments bring their own set of challenges to any HADR system. ML models can be deployed in several ways, due to which it becomes important for architects designing HADR systems to choose the right deployment strategies for best results.
Challenges posed to ML pipelines for high availability
Some of the challenges faced with ML deployments for HADR are -
What is a good ML deployment?
The definition of a good ML deployment changes with who is answering this question. Fir examples -
Business owners - performs fast inference Researchers - highest accuracy Developers - gets built quickly Q/A engineers - never fails Investors - sounds cool, brings in the $$
Volume of data processed
Volume of data can be a major challenge to most ML systems. Too much data and you may be running late at your training and too less of it, your inference suffers.
Quality of data
Data quality refers to how informative and complete a given chunk of data is. The lower the data quality, the tougher it is to derive insights from it.
Model decay
The phenomenon in Machine Learning that leads to predictions made by a model become less accurate over time. Primary reasons for model decay are:
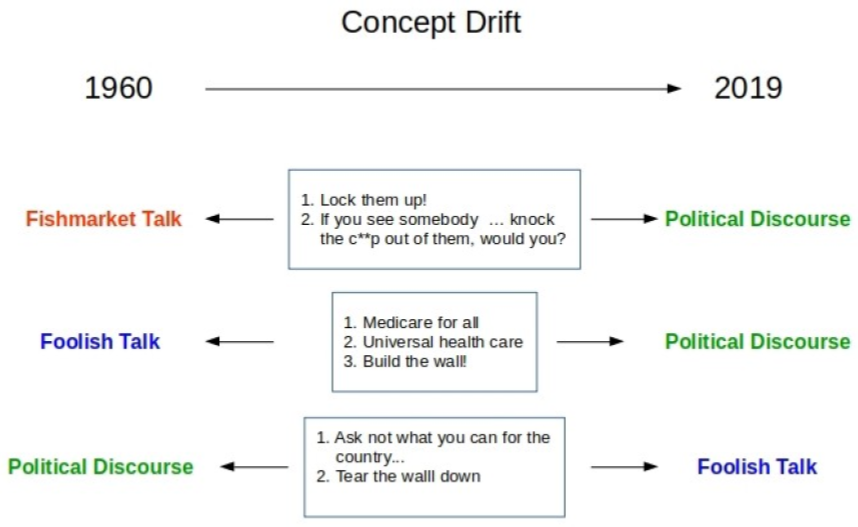
Data drift
Concept drift
Speed of inference against various inputs
Speed of inference can change with changing input. If your model performs inference under 1s for most images ranging appx 10MB, what does it do when someone uploads an image of 1GB? Does your system reject the image or does it take down the building?
Load testing ML-HADR systems
Finally, let us load-test a few topologies which server ML based content. To do so, we shall be using the Locus tool along with a self-engineered set of scripts that work as nodes and load balancer.
I have published the code for this setup here - https://github.com/xprilion/dummy-topology-loadtest
The contents of this system are -
router.py: this file will act as a dummy load-balancer.predictors/predict**X**.py- these files are numbered, replacing X, and will be active as node servers.topology/**topology_name**.json- these json files contain information regarding the topologies available. We will be updating the data inside these files while load testing the topology they represent.
To setup the load test run, first ensure that in the files inside the topology directory, all the topology files are in their initial states, as shown below -
Single server system
In this system, there is a single server handling all resources.
{
    "predict1": {
        "status": true,
        "load": 0,
        "port": "9696"
    }
}
2 Active system
In this system, initially, there are 2 servers responding to requests. In event of failure of any one or both servers, a third system steps in as replacement while the other two are fixed.
{
    "predict1": {
        "status": true,
        "load": 0,
        "port": "9696"
    },
    "predict2": {
        "status": true,
        "load": 0,
        "port": "9697"
    },
    "predict3": {
        "status": false,
        "load": 0,
        "port": "9698"
    }
}
Notice that the status of predict3 server is set to false.
3 Active system
In a 3-active system, there are 3 servers available to handle requests.
{
    "predict1": {
        "status": true,
        "load": 0,
        "port": "9696"
    },
    "predict2": {
        "status": true,
        "load": 0,
        "port": "9697"
    },
    "predict3": {
        "status": true,
        "load": 0,
        "port": "9698"
    }
}
Then, ensure that in router.py, the topology variable is set to 0. This will correspond to the single server system.
Next, we fire up the Locus UI by running the locust command inside the locust directory.
Specify the number of users to spawn and the spawn rate. Provide a suitable host. Locust will inform the server under stress that the requests are coming from the specified host.
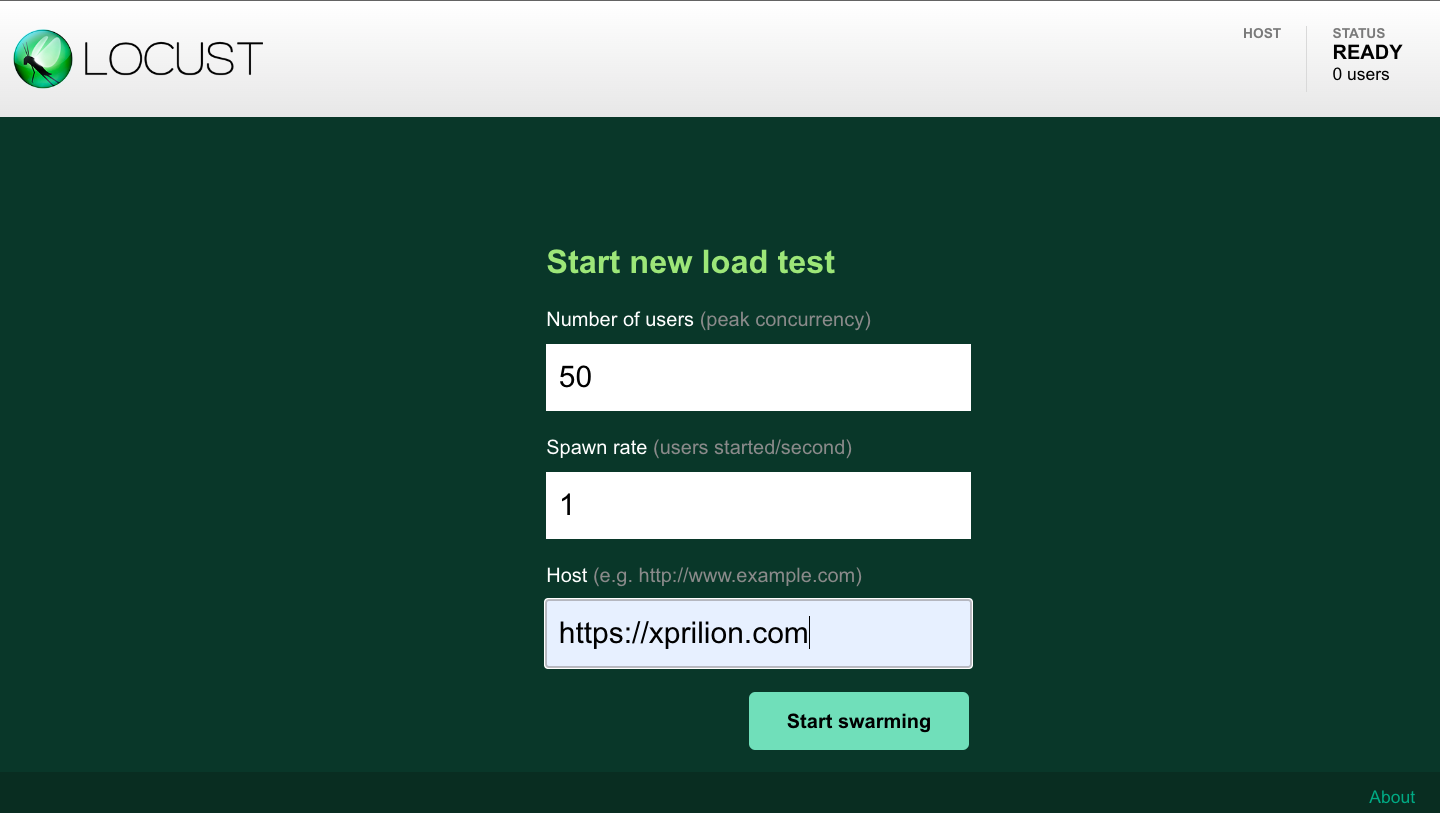
Click on Start Swarming to start throwing requests at the server based on the script specified in the locust/locustfile.py.
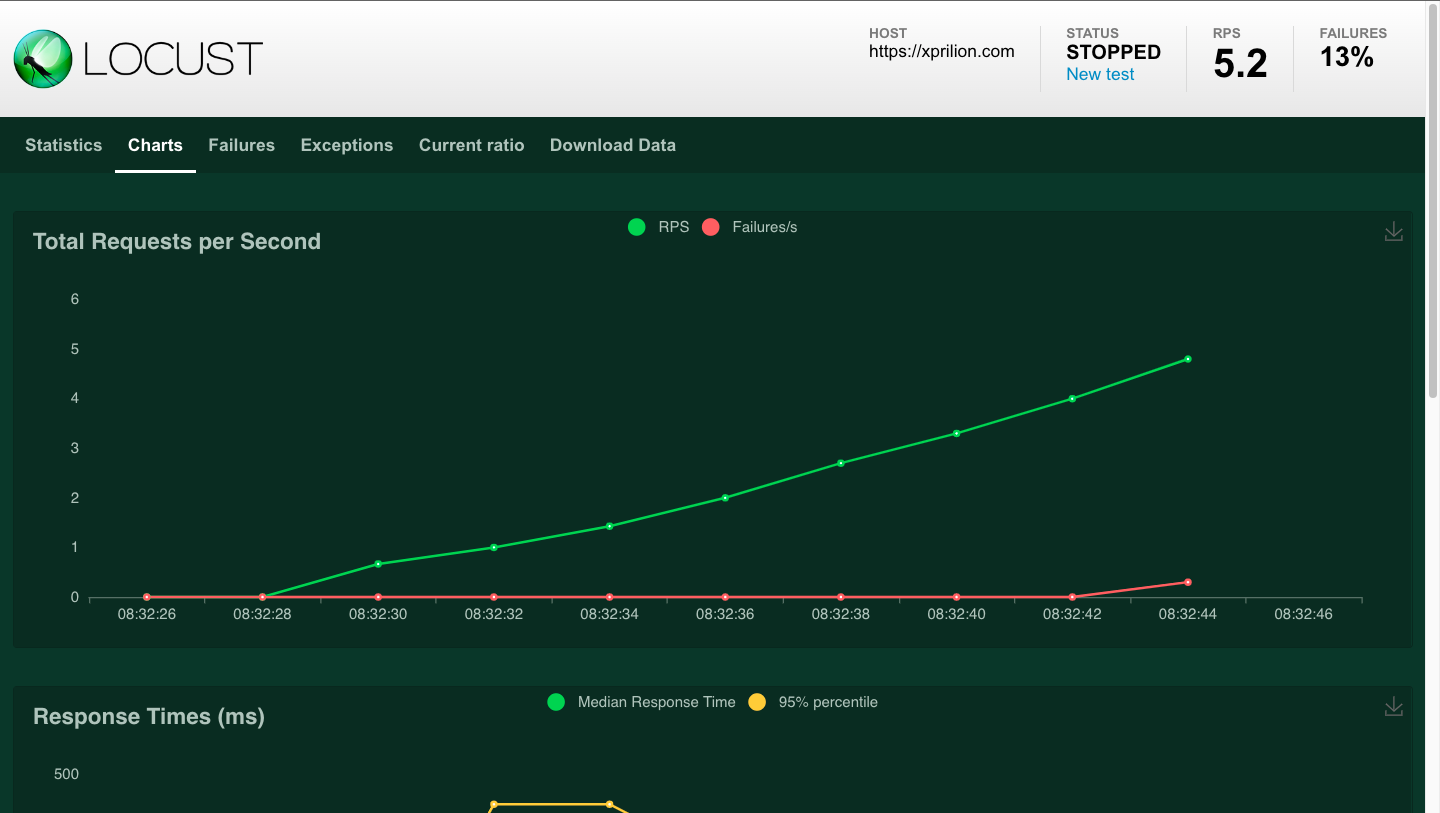
Observe the charts that show how the system is responding to the increase in the load. After some time, the first server failures start appearing. We'll keep a note of when the first error appears.
Now, change the topology variable in router.py to 1 and run Locust. In the next step, change the topology variable to 2 and run Locust again.
Let's plot a chart of when the first failures happen in case of each system -
| Topology | RPS at failure |
| Single | 5.2 |
| 2-Active | 8.6 |
| 3-Active | 7.4 |
As expected, the 2-Active system has the peak capacity in our use-case. However, here's an interesting observation -
Let us compare the values of the predict servers on 2-Active and 3-Active systems after the load test -
| Server | 2-Active | 3-Active |
| Predict1 | 10 | 5 |
| Predict2 | 10 | 7 |
| Predict3 | 9 | 8 |
As we see, the 2-Active system is completely saturated while the 3-Active system is slightly above half its capacity.
Thus, even though the 2-Active system fails after the 3-Active system has shown its first error, the 3-Active system will saturate later and continue to serve requests for a longer duration.
Conclusion
Depending on the HADR system metric you may want to optimize for, you can choose the topology that works best for your use case. You can choose to have multiple replicas of the same network topology or create your own configuration. The scripts provided for load testing can be extended to more topologies. Have fun testing your HADR system designs with it!