1. Introduction
This post is not a step-by-step beginner tutorial. It's a deployment diary: every quota gate I hit, every capacity error I waited out, every Gemma 4 crash I debugged, and the autoscaling stack I wired up once the TPU finally came online. If you're planning to serve an LLM on Cloud TPU through GKE, this is the reference I wish I'd had before I started.
I wanted to deploy Gemma 4 26B on 8 TPU v5e chips with full HPA autoscaling. What I actually deployed was Gemma 3 4B on a single chip, because quota said no. But the architecture is identical - the only difference is a machine type string, a topology label, and a model name. The full autoscaling stack (Prometheus metrics, Custom Metrics Adapter, HorizontalPodAutoscaler) is proven and running.
Who this is for: Engineers who have GKE experience
and want to add TPU-backed LLM inference to their cluster. I assume
you know Kubernetes, gcloud, and at least the basics of
how vLLM works.
Acknowledgment: This project was part of #TPUSprint by Google's AI Developer Programs team. Google Cloud credits were provided for this project. I thank the team for their invaluable support.
Here's what the system looks like at a high level:
                        +------------------+
                        |   Load Balancer  |
                        |   (Service)      |
                        +--------+---------+
                                 |
                        +--------v---------+
                        |  vLLM on TPU v5e |
                        |  (Deployment)    |
                        +--------+---------+
                                 |
              +------------------+------------------+
              |                  |                  |
     +--------v------+  +-------v-------+  +-------v--------+
     | PodMonitoring  |  | GCS FUSE      |  | HF Token       |
     | (Prometheus)   |  | (Model Cache) |  | (K8s Secret)   |
     +--------+------+  +---------------+  +----------------+
              |
     +--------v-----------+
     | Custom Metrics      |
     | Adapter             |
     +--------+------------+
              |
     +--------v-----------+
     | HPA                 |
     | (autoscaling/v2)    |
     +--------+------------+
              |
     +--------v-----------+
     | Node Pool           |
     | Autoscaler          |
     +---------------------+
The repository backing this guide is at github.com/xprilion/gemma3-vllm-tpu-gke-autoscaling.
2. Understanding TPU Quotas on Google Cloud
Before creating anything, I needed to understand the quota landscape. TPU quotas on GCP are not intuitive. There are three independent gates, and all three must pass before a TPU node can be provisioned.
The three-gate model
Gate 1: Regional TPU quota (e.g. TPU_LITE_PODSLICE_V5 = 16 in us-central1)
|
v
Gate 2: Global accelerator cap (GPUS_ALL_REGIONS = ???)
|
v
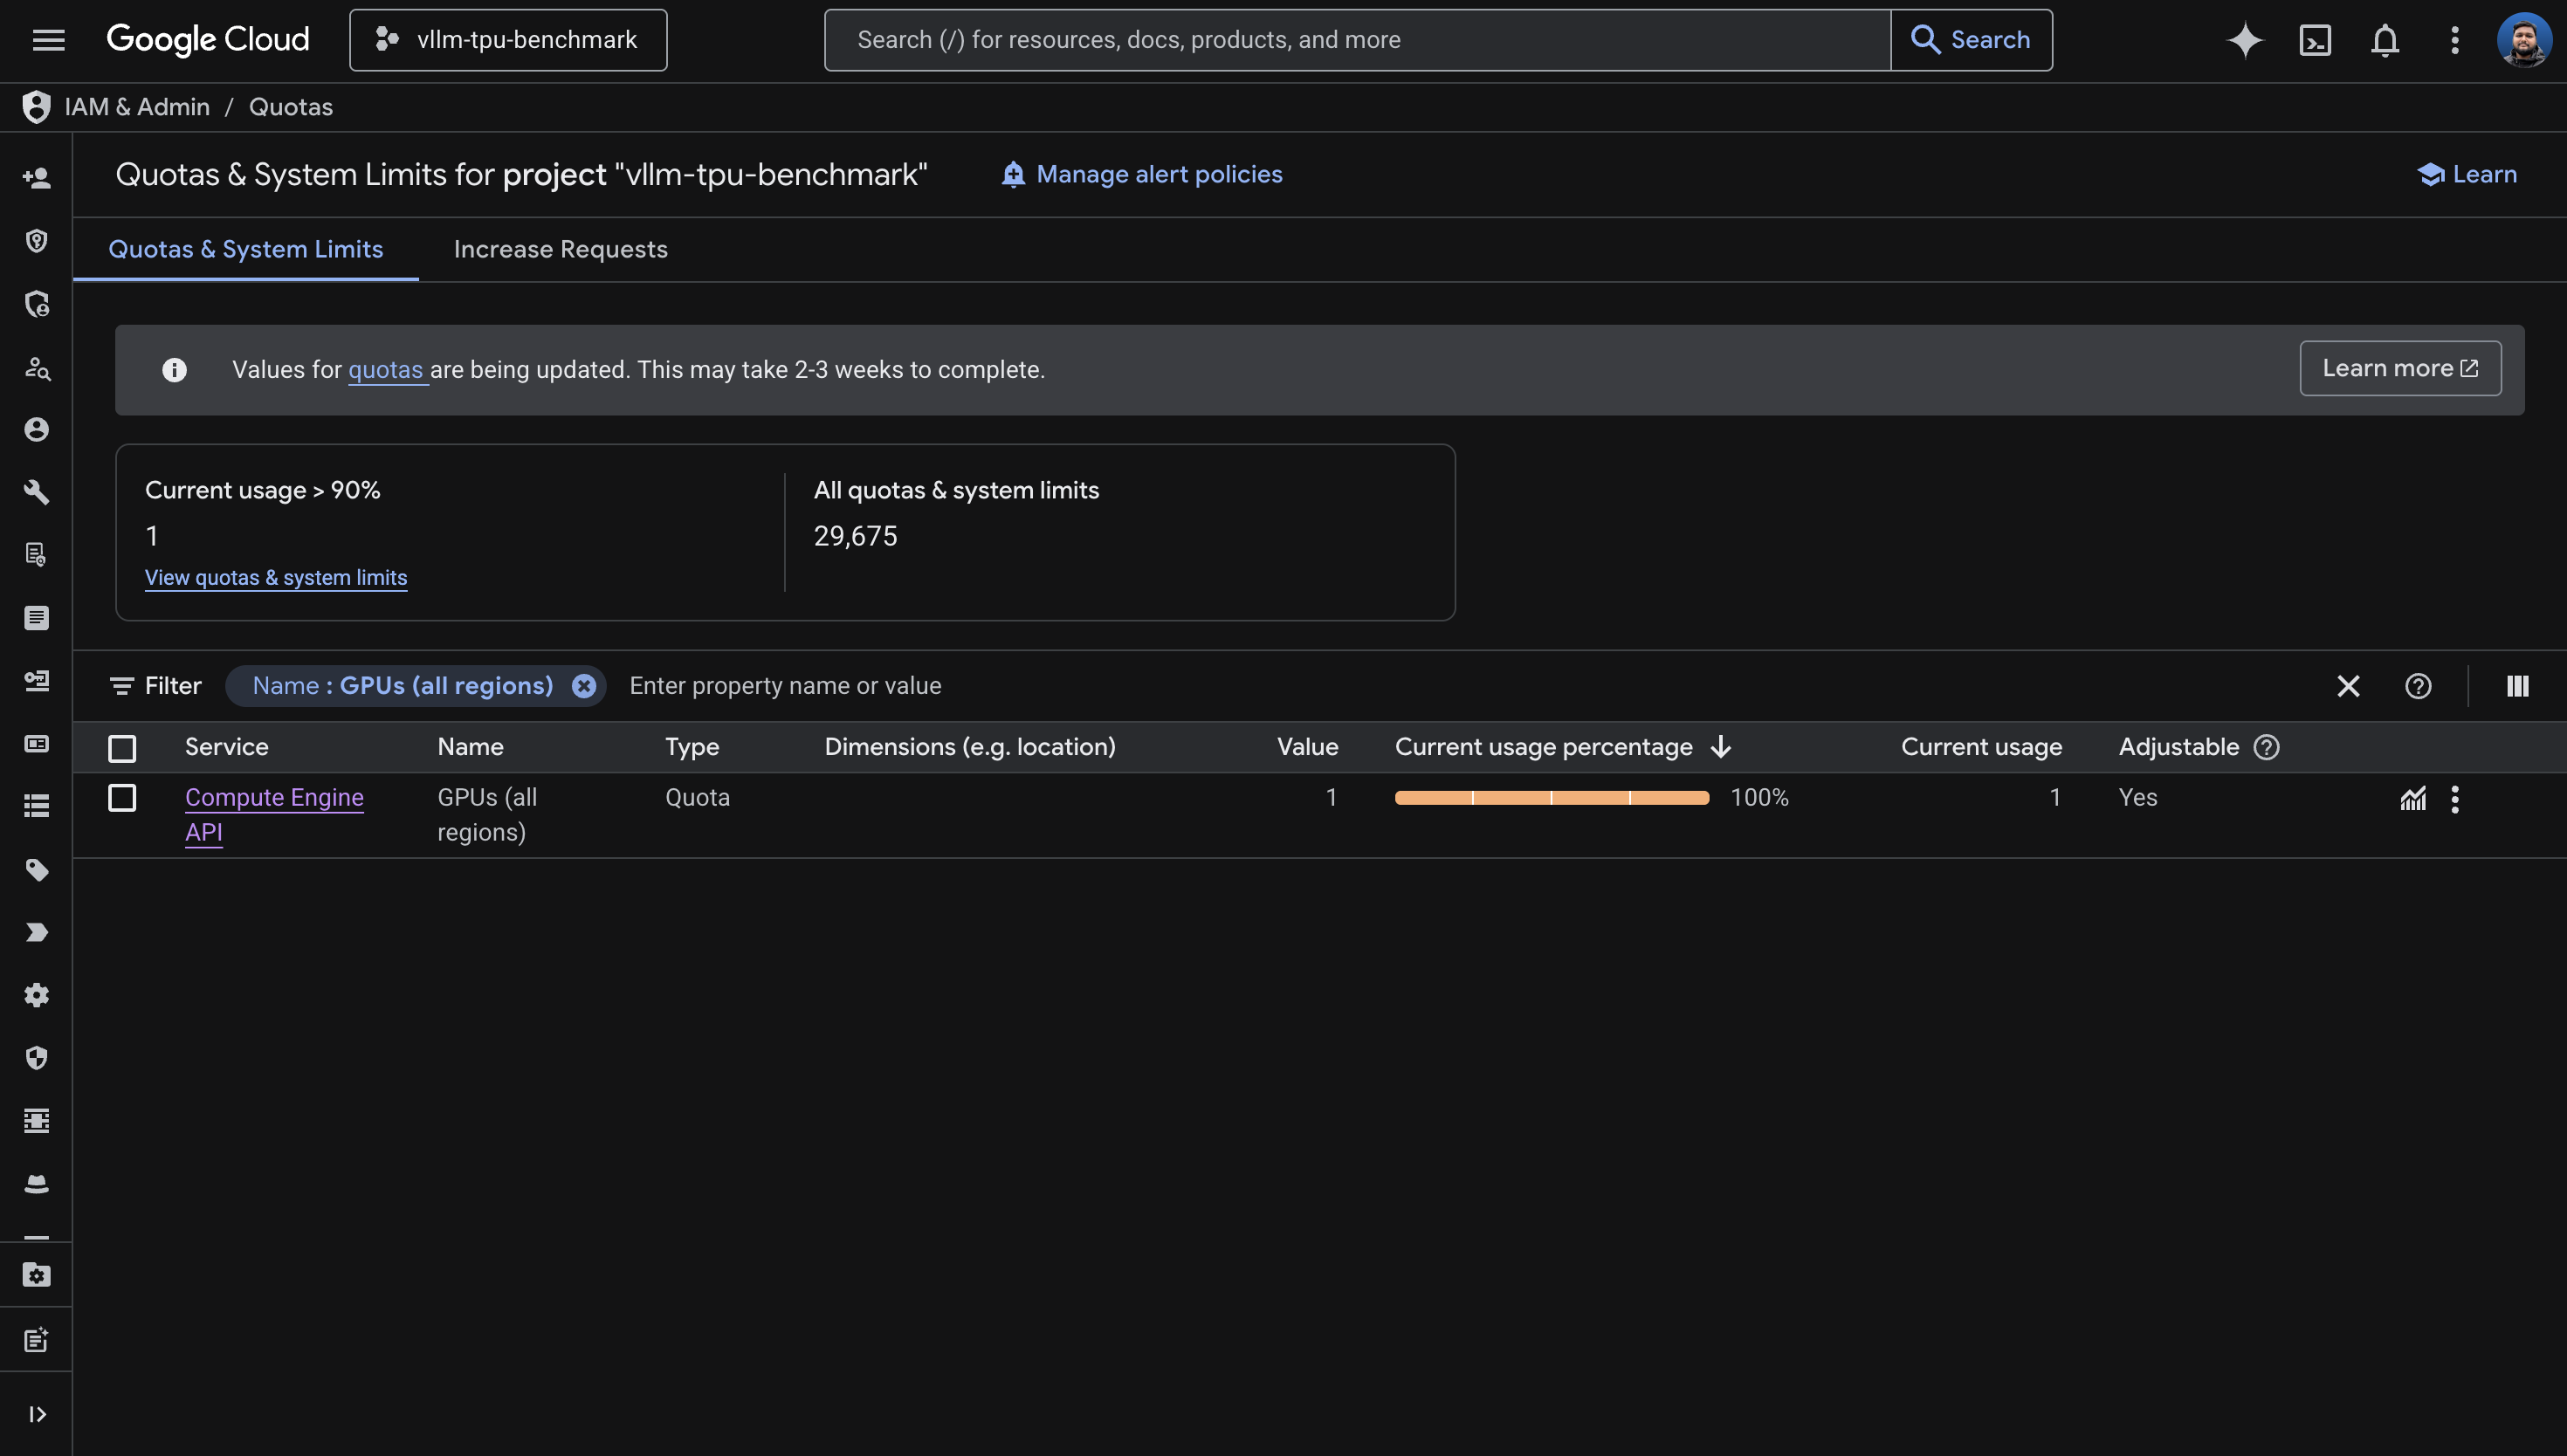
Gate 3: Actual physical capacity (stockout or not)Gate 1 is the regional TPU-specific quota. You'll find it under IAM & Admin > Quotas for a specific region. Most people discover this one, think they're covered, and stop looking.
Gate 2 is a project-level master throttle on all
accelerator resources. Despite the name containing "GPU", it counts
TPU chips too. It's effectively ACCELERATORS_ALL_REGIONS,
but Google never renamed it. I'll come back to this one - it cost me
the most time.
Gate 3 is physical availability. Even with both quotas cleared, TPUs are globally constrained hardware. The zone may simply have nothing available right now.
The quota names you need to know:
| Quota Name | Scope | What It Controls |
|---|---|---|
TPU_LITE_DEVICE_V5 |
Regional | Single-chip v5e devices (v5litepod-1) |
TPU_LITE_PODSLICE_V5 |
Regional | Multi-chip v5e pod slices (v5litepod-4, -8, etc.) |
PREEMPTIBLE_TPU_LITE_PODSLICE_V5 |
Regional | Spot/preemptible versions |
GPUS_ALL_REGIONS |
Global | Master cap on ALL accelerators (GPUs AND TPUs) |
tpu_family:CT6E |
Regional | Trillium (v6e) -- different quota system |
There's a subtle distinction between
TPU_LITE_DEVICE_V5 and TPU_LITE_PODSLICE_V5.
The first covers single-chip machines (ct5lp-hightpu-1t).
The second covers multi-chip machines (ct5lp-hightpu-4t
and above). I had device quota of 0 and podslice quota of 16, which
meant single-chip configs were blocked by regional quota while
multi-chip configs were allowed - until
GPUS_ALL_REGIONS blocked everything anyway.
How to check all quotas at once
Regional TPU quota:
for region in us-central1 us-east1 us-east5 europe-west4 us-west4; do
  echo "=== $region ==="
  gcloud compute regions describe $region --project=YOUR_PROJECT --format=json 2>&1 | \
    python3 -c "
import json, sys
data = json.load(sys.stdin)
for q in data.get('quotas', []):
    m = q.get('metric','')
    if 'TPU' in m and q.get('limit', 0) > 0:
        print(f'  {m}: limit={q[\"limit\"]}, usage={q[\"usage\"]}')
"
done
Global accelerator quota (this is the critical one):
gcloud compute project-info describe --project=YOUR_PROJECT --format=json | python3 -c "
import json, sys
data = json.load(sys.stdin)
for q in data.get('quotas', []):
    if 'GPU' in q.get('metric','') or 'TPU' in q.get('metric',''):
        print(f\"  {q['metric']}: limit={q['limit']}, usage={q['usage']}\")
"
The GPUS_ALL_REGIONS story
I had TPU_LITE_PODSLICE_V5=16 across multiple regions. I
spent a full day trying to create TPU node pools across six zones.
Every attempt came back with capacity errors:
| Zone | Result |
|---|---|
| us-central1-a | Capacity exhausted (waited 35 min) |
| us-east5-b | General stockout (even CPU VMs failed) |
| europe-west4-a | Capacity exhausted (tried v5e-4, v5e-4 spot, v5e-8) |
| us-central1-b | v6e capacity exhausted |
| us-east5-a | v6e capacity exhausted |
After hours of zone-hopping, I tried us-central1-a again.
This time, instead of a capacity error, I got:
Quota 'GPUS_ALL_REGIONS' exceeded. Limit: 0.0 globally.The earlier capacity errors had been masking the quota issue. When there's no physical capacity, GKE returns a capacity error before it even checks quota. Once capacity opened up, the quota gate kicked in and blocked me. I'd been waiting for capacity that wouldn't have helped.
How GPUS_ALL_REGIONS is counted
I tested this empirically. The quota is counted per chip, not per node:
| Machine Type | Chips | GPUS_ALL_REGIONS needed |
|---|---|---|
ct5lp-hightpu-1t |
1 | 1 (confirmed: works with quota=1) |
ct5lp-hightpu-4t |
4 | 4 (inferred) |
ct5lp-hightpu-8t |
8 | 8 (confirmed: fails with quota=1) |
With GPUS_ALL_REGIONS=1, creating a
ct5lp-hightpu-8t node fails with "Quota exceeded. Limit:
1.0 globally." Creating a ct5lp-hightpu-1t succeeds. The
counting is per-chip.
The quota request experience
I requested an increase from 0 to 16. Google's response:
We're unable to grant your requested increase at this time, as it requires support from your Sales Team. However, you still have an option to create a new request for 1 GPUS_ALL_REGIONS.
So I took the 1. With 1 chip of quota, I could only use
ct5lp-hightpu-1t (16GB HBM), which limits me to models
under roughly 8B parameters in bf16. If you need more than 1 chip, you
need to engage Google Cloud Sales. This is not a self-service
operation for new projects.
3. Capacity Planning and Zone Selection
Having quota doesn't mean having capacity. TPU availability is constrained globally, and it varies by zone and time of day.
How to scan for TPU availability
List TPU accelerator types available in a zone:
gcloud compute tpus accelerator-types list \
  --zone=us-central1-a --project=YOUR_PROJECT
List GKE machine types in a zone:
gcloud compute machine-types list \
  --zones=us-central1-a --project=YOUR_PROJECT \
  --filter="name~ct5lp OR name~ct6e" \
  --format="value(name)"
Machine type reference
| Machine Type | TPU Version | Chips | HBM | Host Type |
|---|---|---|---|---|
ct5lp-hightpu-1t |
v5e | 1 | 16GB | Single-host |
ct5lp-hightpu-4t |
v5e | 4 | 64GB | Single-host |
ct5lp-hightpu-8t |
v5e | 8 | 128GB | Single-host |
ct6e-standard-1t |
v6e (Trillium) | 1 | 32GB | Single-host |
ct6e-standard-4t |
v6e (Trillium) | 4 | 128GB | Single-host |
ct6e-standard-8t |
v6e (Trillium) | 8 | 256GB | Single-host |
Zone availability map (April 2026)
| Zone | v5e machine types | v6e machine types |
|---|---|---|
| us-central1-a | 1t, 4t, 8t | 1t, 4t, 8t |
| us-central1-b | None | 1t, 4t, 8t |
| us-central1-c | None | 1t, 4t, 8t |
| europe-west4-a | 1t, 4t, 8t | 1t, 4t, 8t |
| europe-west4-b | 1t, 4t, 8t | None |
| us-east5-a | 1t, 4t, 8t | 1t, 4t, 8t |
| us-east5-b | 1t, 4t, 8t | 1t, 4t, 8t |
| us-east5-c | 1t, 4t, 8t | 1t, 4t, 8t |
I tried every zone on this list over the course of a full day.
Capacity was exhausted everywhere. Eventually, after receiving
GPUS_ALL_REGIONS=1, a single-chip node provisioned
successfully in us-central1-a within minutes.
The practical strategy: create the node pool with
--min-nodes=0 and let GKE retry automatically. Capacity
fluctuates. The node pool sits in a "waiting for capacity" state and
provisions as soon as hardware opens up. Don't delete and recreate
across zones - that's what I did, and it wasted hours. The key
distinction: capacity errors auto-retry. Quota errors are permanent
until you request an increase.
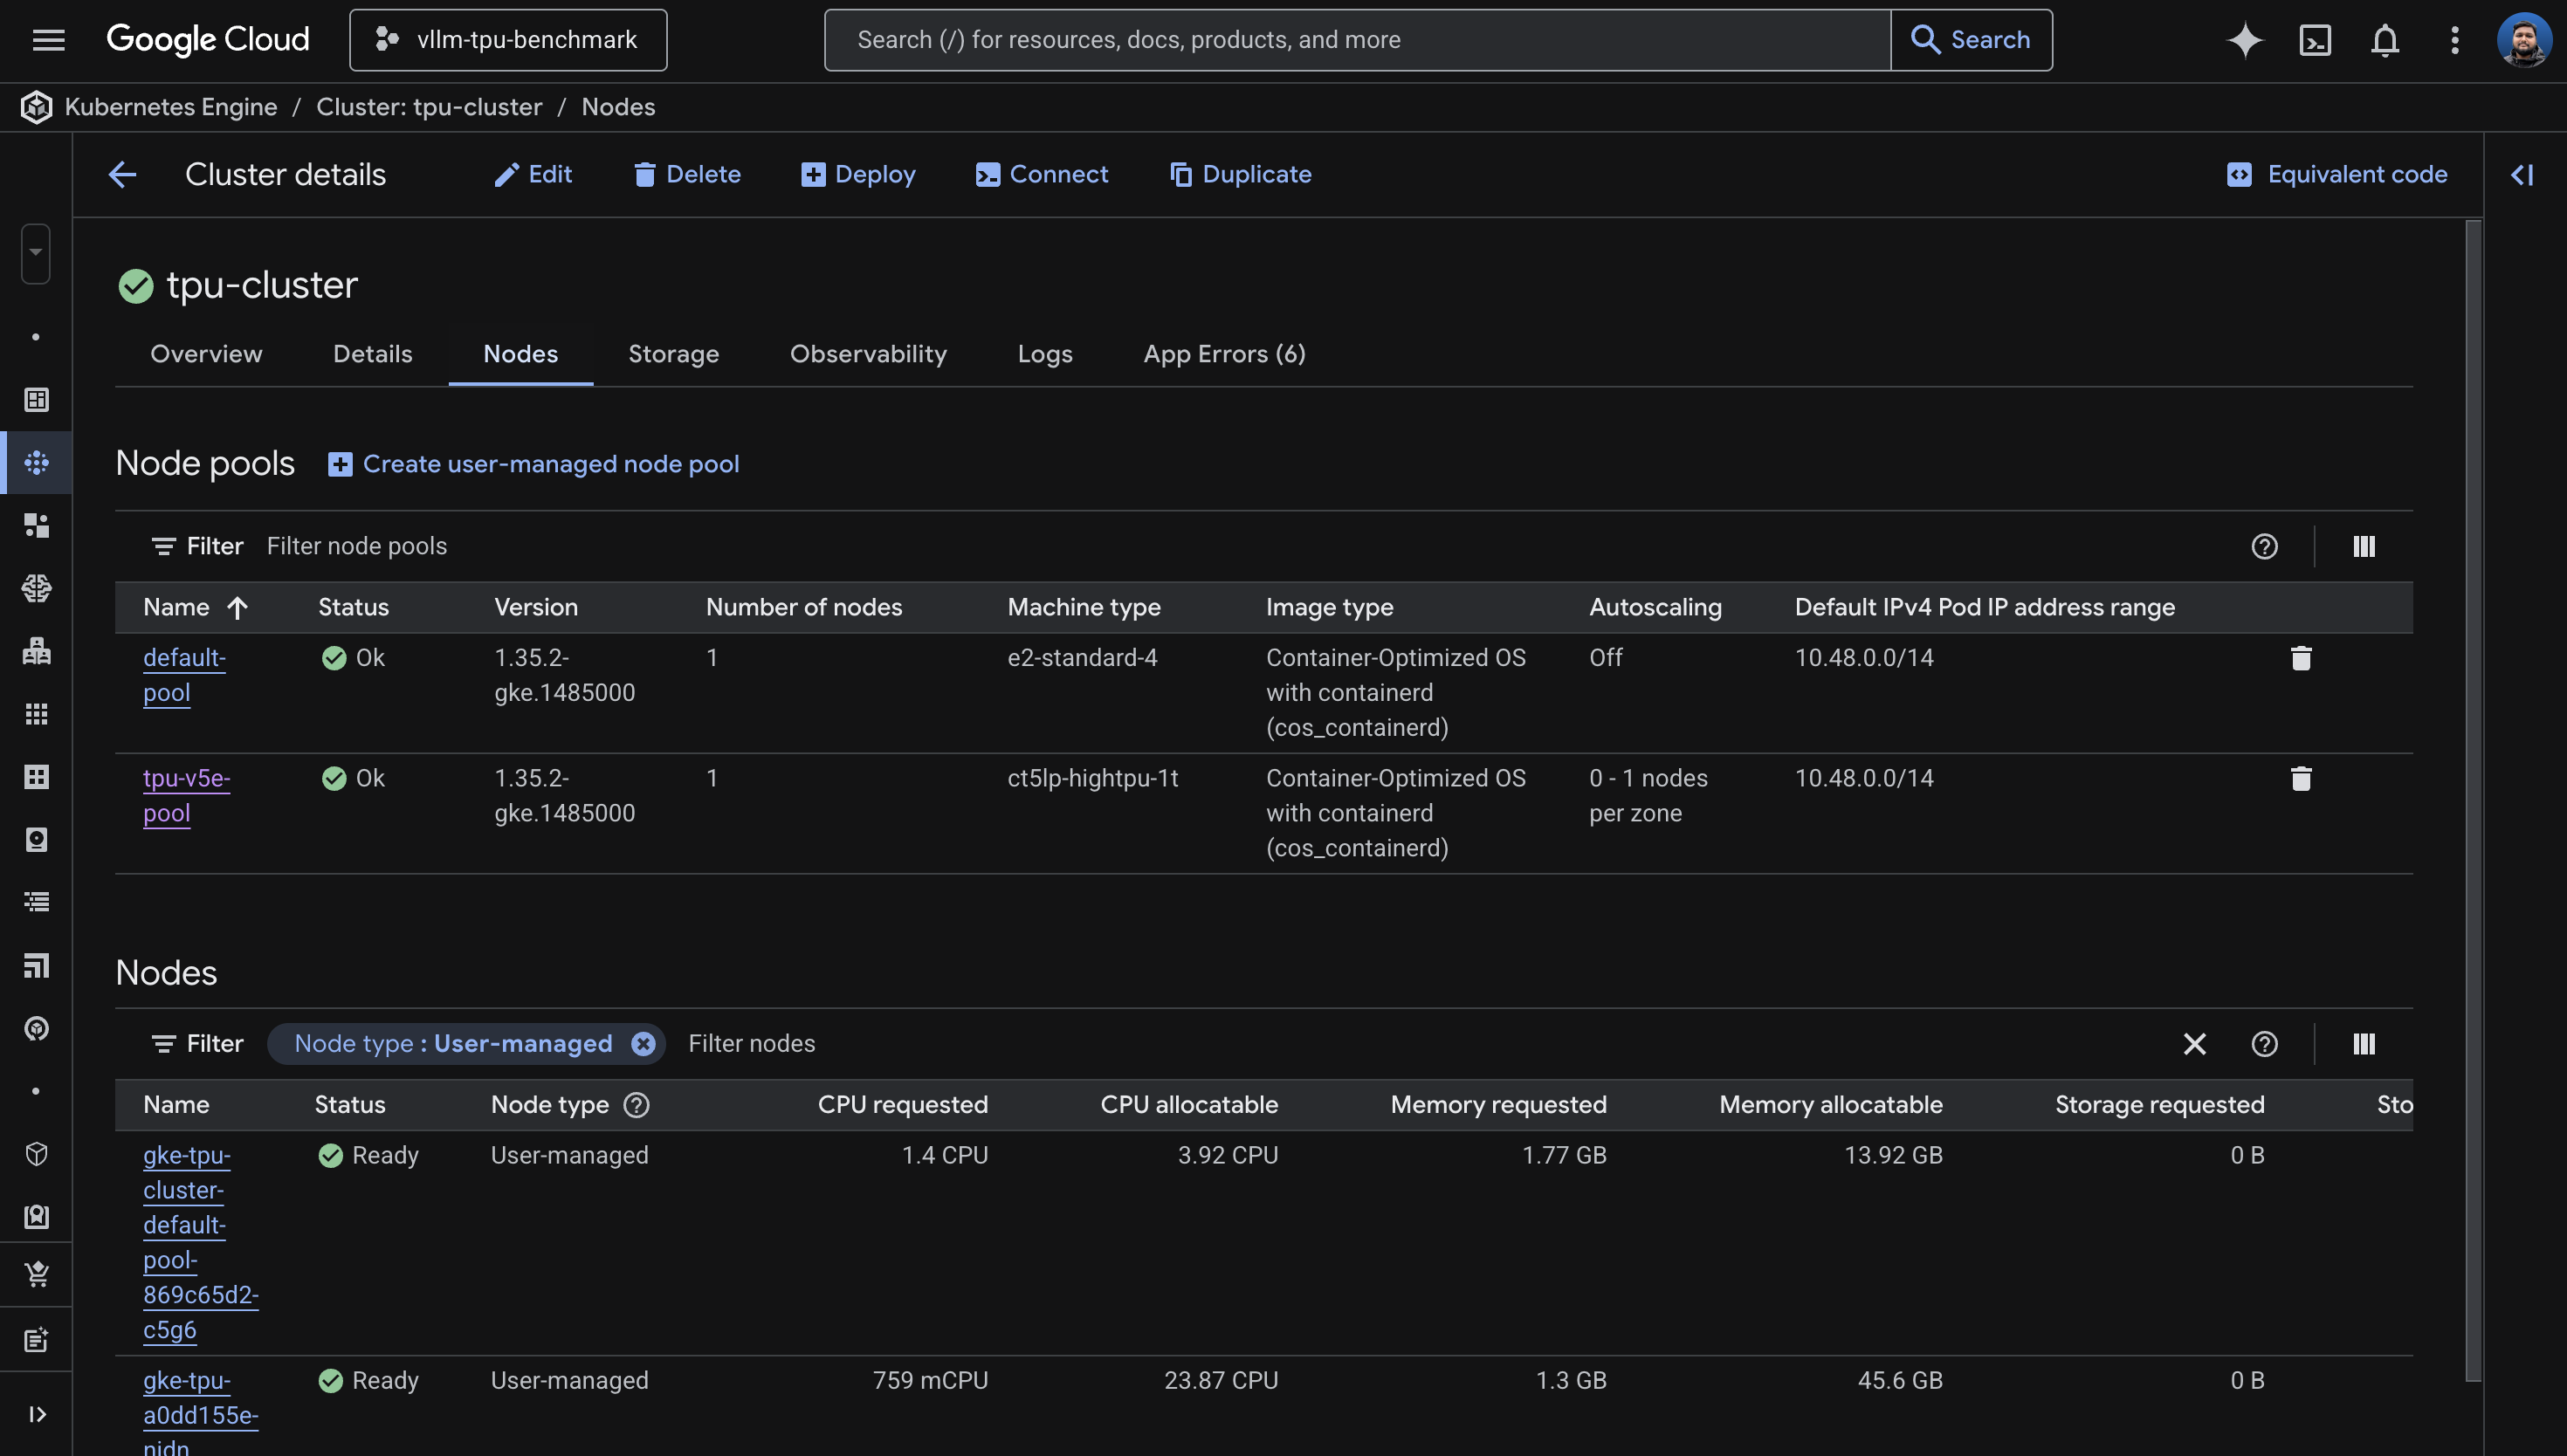
4. Cluster Setup
I learned this one the hard way: enabling Workload Identity and GCS FUSE after cluster creation takes about 30 minutes (two separate 15-minute updates that can't run in parallel). The fast path is to enable everything at creation time.
The fast way
gcloud container clusters create tpu-cluster \
  --zone=us-central1-a \
  --release-channel=rapid \
  --machine-type=e2-standard-4 \
  --num-nodes=1 \
  --workload-pool=YOUR_PROJECT.svc.id.goog \
  --addons=GcsFuseCsiDriver \
  --project=YOUR_PROJECT
Use --release-channel=rapid to get GKE 1.35.x, which has
the best TPU support. The default pool (e2-standard-4) is
just for system workloads. Cluster creation takes 8-12 minutes.
The slow way (if the cluster already exists)
Workload Identity must be enabled before GCS FUSE.
They cannot be combined into one
gcloud container clusters update command. I tried - it
errors out with "Exactly one of [...] must be specified."
# Step 1: Workload Identity (~15 min)
gcloud container clusters update tpu-cluster \
  --zone=us-central1-a --project=YOUR_PROJECT \
  --workload-pool=YOUR_PROJECT.svc.id.goog

# Step 2: GCS FUSE (~15 min, FAILS if step 1 isn't done)
gcloud container clusters update tpu-cluster \
  --zone=us-central1-a --project=YOUR_PROJECT \
  --update-addons=GcsFuseCsiDriver=ENABLED
If you try to enable GCS FUSE without Workload Identity:
INVALID_ARGUMENT: Workload Identity must be enabled for GCS Fuse CSI driver addon.Two sequential update calls, 15 minutes each. Save yourself the 30 minutes and enable both at creation time.
5. TPU Node Pool Configuration
This is the number one source of confusion in GKE TPU setup: for TPU
node pools, you use --machine-type, not
--accelerator. The --accelerator flag is for
GPUs only. I'd wager most people's first attempt uses
--accelerator, because that's what every GPU tutorial
teaches.
The correct syntax
gcloud container node-pools create tpu-v5e-pool \
  --cluster=tpu-cluster \
  --zone=us-central1-a \
  --machine-type=ct5lp-hightpu-1t \
  --num-nodes=1 \
  --enable-autoscaling --min-nodes=0 --max-nodes=1 \
  --project=YOUR_PROJECT
Wrong ways I tried
# WRONG: --accelerator is for GPUs, not TPUs
--accelerator type=tpu-v5-lite,count=1
--accelerator type=v5litepod-1,count=1

# WRONG: single-host types reject --tpu-topology in some zones
--machine-type=ct5lp-hightpu-8t --tpu-topology=2x4

# WRONG: autoscale max must be compatible with topology for multi-host
--tpu-topology=2x2 --max-nodes=4
When to use --tpu-topology
For single-host types (1t, 4t, 8t): do not specify
--tpu-topology. The behavior is inconsistent across
zones. In us-central1-a,
ct5lp-hightpu-4t --tpu-topology=2x2 was accepted. In
us-east5-a, the same command returned "Unsupported TPU
configuration." For single-host types, just omit it.
For multi-host types (16t and above): you must
specify --tpu-topology (e.g., 4x4).
Capacity errors vs. quota errors
When node creation fails, the error message tells you whether to wait or give up. Learning to read these saved me significant time.
Capacity error - wait, it auto-retries:
TPU: the nodes cannot be created now due to lack of capacity.
They will be created asynchronously once capacity is available.
The node pool is created, the managed instance group keeps retrying in the background. Leave it alone.
Quota error - stop, this needs manual action:
Quota 'GPUS_ALL_REGIONS' exceeded. Limit: 1.0 globally.Hard stop. No amount of waiting fixes this. You need to increase quota first.
6. Model Selection and Gemma 4 Compatibility
Choosing a model for TPU inference is a function of two constraints: how much HBM your machine type provides, and whether vLLM's TPU backend actually supports the model architecture.
HBM sizing
| Hardware | HBM | Max Model (bf16) | Recommended |
|---|---|---|---|
ct5lp-hightpu-1t (1 chip) |
16GB | ~8B params | Gemma 3 4B |
ct5lp-hightpu-4t (4 chips) |
64GB | ~32B params | Gemma 3 27B |
ct5lp-hightpu-8t (8 chips) |
128GB | ~64B params | Gemma 4 26B MoE, Llama 3.1 70B |
ct6e-standard-8t (8 chips) |
256GB | ~128B params | Llama 3.1 70B with room |
vLLM TPU support matrix (April 2026)
From the vllm-project/tpu-inference support matrix:
| Model | Status on TPU |
|---|---|
google/gemma-3-27b-it |
Fully passing (unit + correctness + performance) |
meta-llama/Llama-3.1-8B-Instruct |
Fully passing |
meta-llama/Llama-3.3-70B-Instruct |
Fully passing |
google/gemma-4-26B-A4B-it |
Unit tests FAILING on nightly |
google/gemma-4-31B-it |
Unit tests FAILING on nightly |
google/gemma-4-E4B-it |
FAILING -- shared layers (I tested) |
google/gemma-4-E2B-it |
FAILING -- shared layers (I tested) |
I tried Gemma 4. Four times.
I attempted every Gemma 4 variant on vLLM TPU nightly. Each failed at a different stage, which made the debugging interesting - the errors formed a progression from "too old" to "architecturally incompatible."
Attempt 1: vllm/vllm-tpu:latest (v0.18.0) + Gemma 4 E4B
ValueError: The checkpoint you are trying to load has model type `gemma4`
but Transformers does not recognize this architecture.
The stable image's Transformers library is too old to know about the Gemma 4 architecture. Fair enough - I switched to nightly.
Attempt 2: vllm/vllm-tpu:nightly + Gemma 4 E4B
ValueError: Chunked MM input disabled but max_tokens_per_mm_item (2496)
is larger than max_num_batched_tokens (256).
Gemma 4 is multimodal and needs
--max-num-batched-tokens >= 2496. I added that flag
and tried again.
Attempt 3: vllm/vllm-tpu:nightly + Gemma 4 E4B + fixed batch tokens
AssertionError: Expect no shared layers
This is the actual blocker. Gemma 4's architecture uses weight-tied
(shared) layers. The tpu-inference backend asserts that
these don't exist. This is a code-level limitation in both the Flax
and TorchAX paths, not a configuration issue.
Attempt 4: vllm/vllm-tpu:nightly + Gemma 4 E2B (smaller variant)
AssertionError: Expect no shared layersSame error. All Gemma 4 models share this architecture trait. The fix needs to come from the vLLM TPU team.
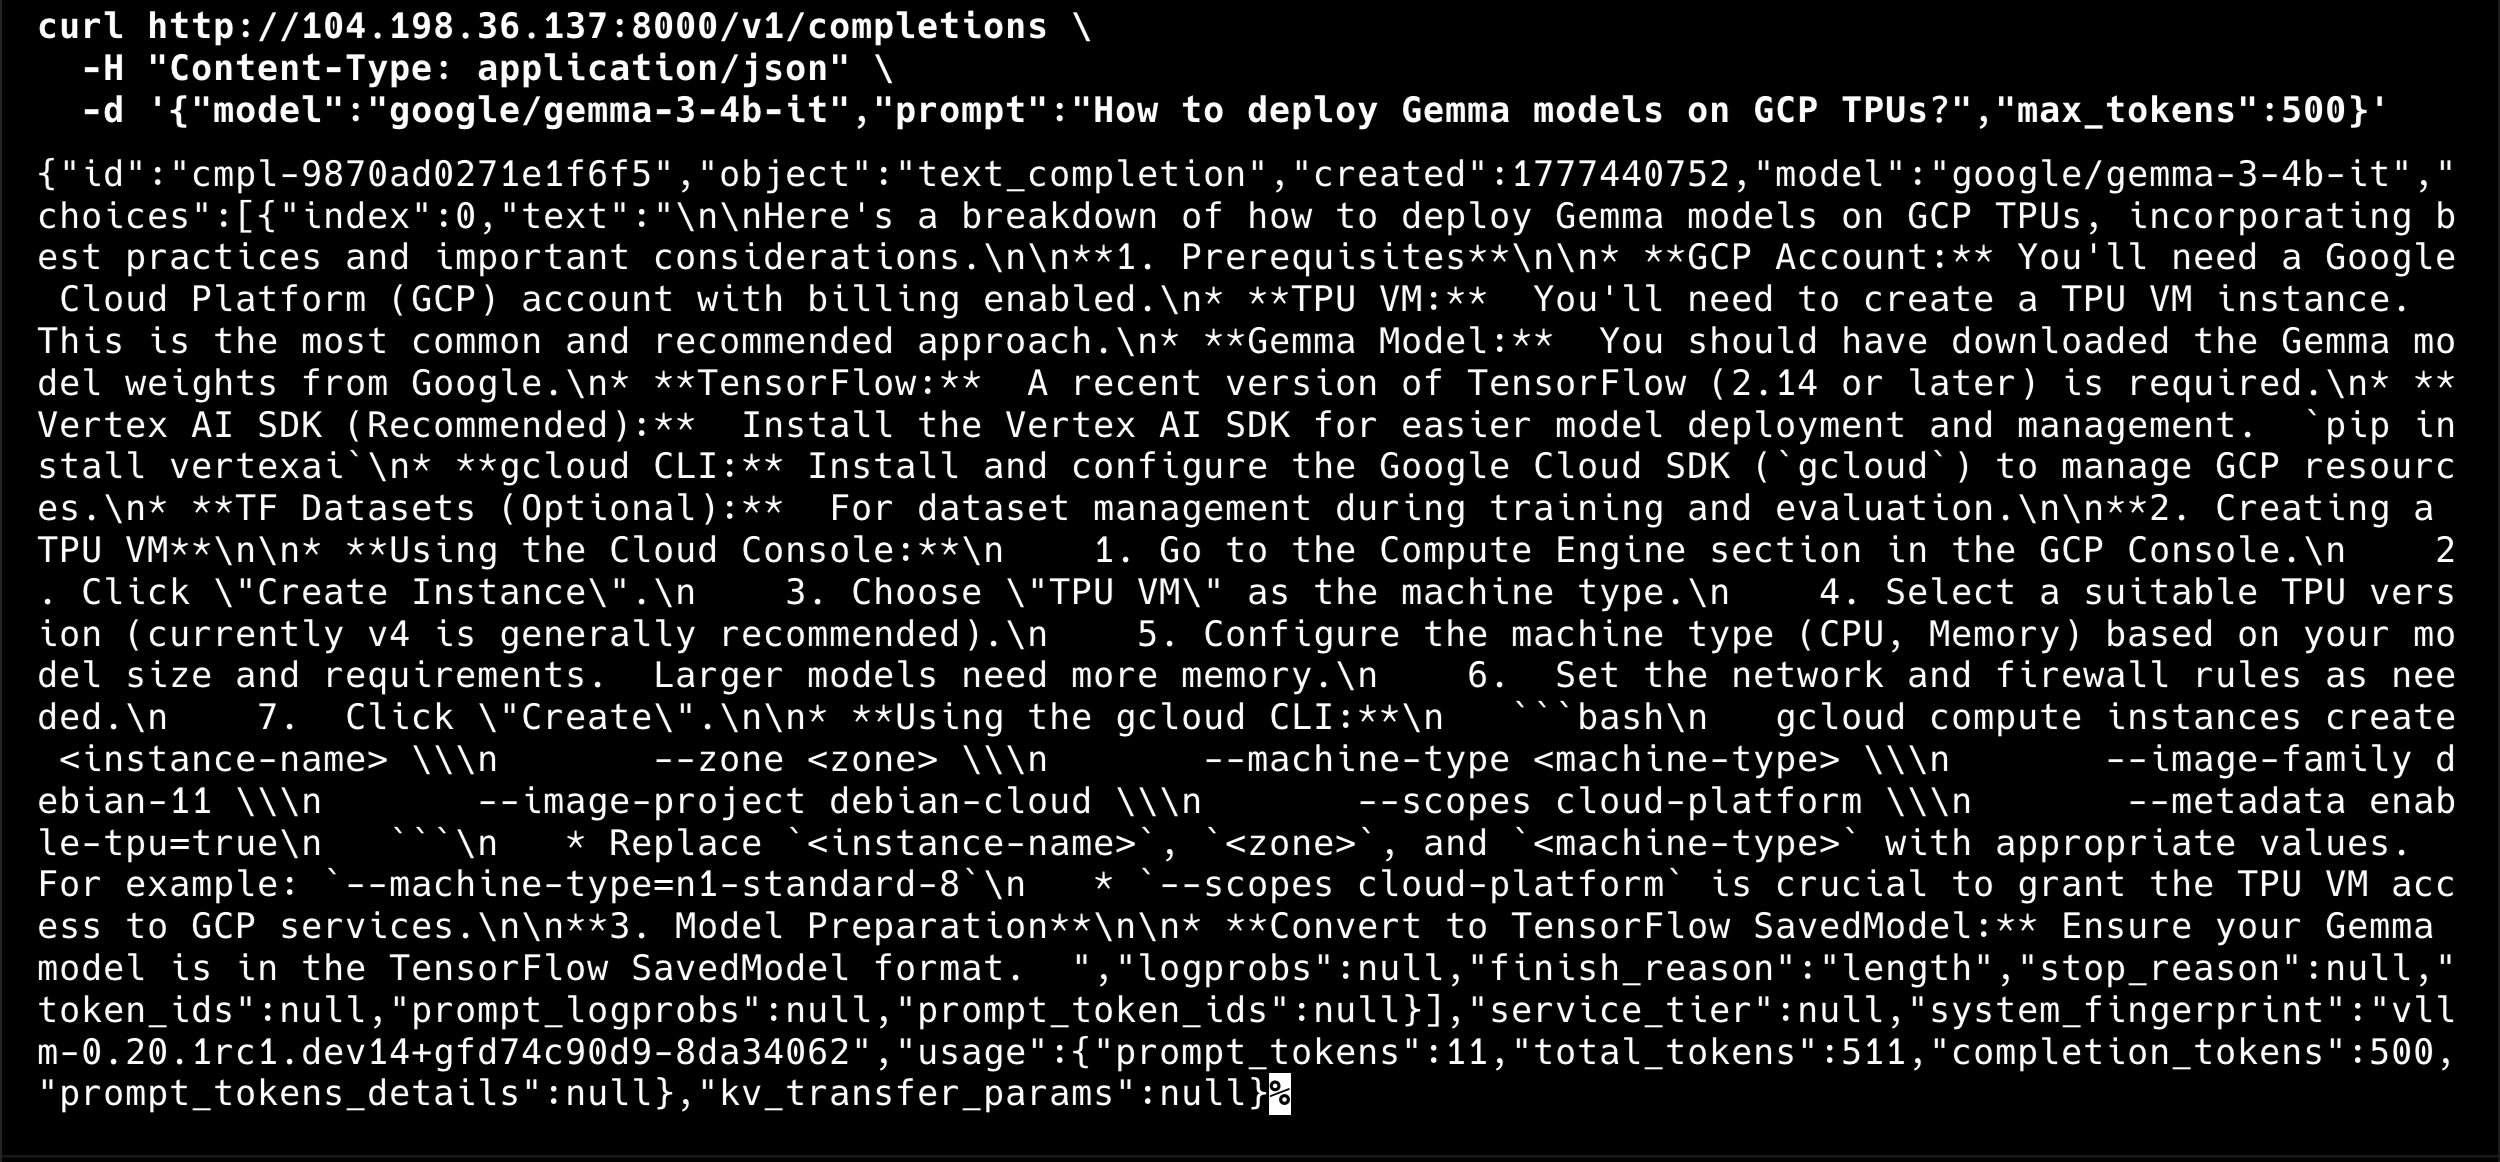
Workaround: use Gemma 3.
google/gemma-3-4b-it for 1 chip or
google/gemma-3-27b-it for 4-8 chips are fully validated.
I deployed Gemma 3 4B on my single TPU v5e chip, and it works
perfectly.
7. Deploying vLLM on TPU
The nodeSelector labels
GKE Warden enforces that TPU pods have both the accelerator and topology nodeSelector labels. Missing either one causes an instant admission webhook rejection:
GKE Warden rejected the request because it violates one or more constraints.
Missing nodeSelector/nodeAffinity label cloud.google.com/gke-tpu-topology.
I'd recommend checking what labels your TPU nodes actually have before writing the Deployment manifest:
kubectl get nodes -l cloud.google.com/gke-tpu-accelerator -o json | \
  python3 -c "
import json, sys
for node in json.load(sys.stdin)['items']:
    labels = {k:v for k,v in node['metadata']['labels'].items() if 'tpu' in k}
    print(f\"{node['metadata']['name']}: {labels}\")
"
For my ct5lp-hightpu-1t node, the labels were:
cloud.google.com/gke-tpu-accelerator: tpu-v5-lite-podslice
cloud.google.com/gke-tpu-topology: 1x1
For ct5lp-hightpu-8t, they would be:
cloud.google.com/gke-tpu-accelerator: tpu-v5-lite-podslice
cloud.google.com/gke-tpu-topology: 2x4
Key deployment fields
Four fields must stay in sync with your hardware:
nodeSelector:
  cloud.google.com/gke-tpu-accelerator: tpu-v5-lite-podslice
  cloud.google.com/gke-tpu-topology: 1x1      # match your machine type!
resources:
  limits:
    google.com/tpu: 1                           # match your chip count!
args:
  - --tensor-parallel-size=1                    # match your chip count!
  - --model=google/gemma-3-4b-it                # match your HBM capacity!
I chose strategy: Recreate rather than
RollingUpdate. TPU resources can't be shared between an
old and new pod simultaneously - the device is exclusive. Recreate
kills the old pod first, then starts the new one.
View full manifest: k8s/vllm-deployment.yaml
apiVersion: apps/v1
kind: Deployment
metadata:
  name: vllm-tpu
  namespace: vllm
spec:
  replicas: 1
  strategy:
    type: Recreate
  selector:
    matchLabels:
      app: vllm-tpu
  template:
    metadata:
      labels:
        app: vllm-tpu
      annotations:
        gke-gcsfuse/volumes: "true"
        gke-gcsfuse/cpu-limit: "0"
        gke-gcsfuse/memory-limit: "0"
        gke-gcsfuse/ephemeral-storage-limit: "0"
    spec:
      serviceAccountName: vllm-gcs-sa
      nodeSelector:
        cloud.google.com/gke-tpu-accelerator: tpu-v5-lite-podslice
        cloud.google.com/gke-tpu-topology: 1x1
      containers:
      - name: vllm-tpu
        image: vllm/vllm-tpu:nightly
        command: ["python3", "-m", "vllm.entrypoints.openai.api_server"]
        args:
        - --host=0.0.0.0
        - --port=8000
        - --tensor-parallel-size=1
        - --max-model-len=1024
        # Gemma 4 fails on vLLM TPU: "Expect no shared layers" (all Gemma 4 variants)
        # Tracked at: https://github.com/vllm-project/tpu-inference
        # - --model=google/gemma-4-E4B-it     # 8B, fails: shared layers
        # - --model=google/gemma-4-E2B-it     # 5B, fails: shared layers
        # - --model=google/gemma-4-26B-A4B-it # 26B MoE, fails: shared layers
        - --model=google/gemma-3-4b-it
        - --download-dir=/data
        - --max-num-batched-tokens=4096
        - --max-num-seqs=16
        - --dtype=bfloat16
        env:
        - name: HUGGING_FACE_HUB_TOKEN
          valueFrom:
            secretKeyRef:
              name: hf-secret
              key: hf_api_token
        - name: VLLM_XLA_CACHE_PATH
          value: "/data"
        - name: VLLM_USE_V1
          value: "1"
        ports:
        - containerPort: 8000
        resources:
          limits:
            google.com/tpu: 1
        readinessProbe:
          tcpSocket:
            port: 8000
          initialDelaySeconds: 120
          periodSeconds: 10
        livenessProbe:
          tcpSocket:
            port: 8000
          initialDelaySeconds: 300
          periodSeconds: 30
        volumeMounts:
        - name: gcs-fuse-csi-ephemeral
          mountPath: /data
        - name: dshm
          mountPath: /dev/shm
      volumes:
      - name: gke-gcsfuse-cache
        emptyDir:
          medium: Memory
      - name: dshm
        emptyDir:
          medium: Memory
      - name: gcs-fuse-csi-ephemeral
        csi:
          driver: gcsfuse.csi.storage.gke.io
          volumeAttributes:
            bucketName: YOUR_BUCKET_NAME
            mountOptions: "implicit-dirs,file-cache:enable-parallel-downloads:true,file-cache:parallel-downloads-per-file:100,file-cache:max-parallel-downloads:-1,file-cache:download-chunk-size-mb:10,file-cache:max-size-mb:-1"
---
apiVersion: v1
kind: Service
metadata:
  name: vllm-service
  namespace: vllm
spec:
  selector:
    app: vllm-tpu
  type: LoadBalancer
  ports:
  - name: http
    protocol: TCP
    port: 8000
    targetPort: 8000
GCS FUSE for model weight caching
The first pod downloads weights from Hugging Face, which takes 5-20 minutes depending on model size. Subsequent pods read from the GCS cache and start in 1-3 minutes. I enabled parallel downloads for speed:
mountOptions: "implicit-dirs,file-cache:enable-parallel-downloads:true,file-cache:parallel-downloads-per-file:100,file-cache:max-parallel-downloads:-1"This makes a significant difference for scale-up time. The second replica can be serving requests within a few minutes of the node becoming available, rather than waiting for a full download.
8. Autoscaling with HPA and Managed Prometheus
The autoscaling infrastructure has three layers, each bridging a gap between what vLLM exposes and what Kubernetes HPA can consume.
Layer 1: PodMonitoring
Google Cloud Managed Prometheus is enabled by default on GKE. I
configured a PodMonitoring resource to scrape vLLM's
/metrics endpoint every 15 seconds. This is the source of
truth for how the model server is doing.
apiVersion: monitoring.googleapis.com/v1
kind: PodMonitoring
metadata:
  name: vllm-pod-monitoring
  namespace: vllm
spec:
  selector:
    matchLabels:
      app: vllm-tpu
  endpoints:
  - path: /metrics
    port: 8000
    interval: 15s
View full manifest: k8s/pod-monitoring.yaml
apiVersion: monitoring.googleapis.com/v1
kind: PodMonitoring
metadata:
  name: vllm-pod-monitoring
  namespace: vllm
spec:
  selector:
    matchLabels:
      app: vllm-tpu
  endpoints:
  - path: /metrics
    port: 8000
    interval: 15s
Layer 2: Custom Metrics Adapter
This bridges Prometheus metrics to the Kubernetes custom metrics API, which is what HPA reads from. Without it, HPA has no way to see application-level metrics.
kubectl apply -f https://raw.githubusercontent.com/GoogleCloudPlatform/k8s-stackdriver/master/custom-metrics-stackdriver-adapter/deploy/production/adapter_new_resource_model.yamlThe adapter's service account needs monitoring access:
PROJECT_NUMBER=$(gcloud projects describe YOUR_PROJECT --format="value(projectNumber)")
gcloud projects add-iam-policy-binding projects/YOUR_PROJECT \
  --role roles/monitoring.viewer \
  --member="principal://iam.googleapis.com/projects/$PROJECT_NUMBER/locations/global/workloadIdentityPools/YOUR_PROJECT.svc.id.goog/subject/ns/custom-metrics/sa/custom-metrics-stackdriver-adapter"
Layer 3: HorizontalPodAutoscaler
Two vLLM metrics are useful for autoscaling on TPU:
| Metric | Best For | When It Grows |
|---|---|---|
num_requests_waiting |
Throughput / cost optimization | KV cache is full, requests queue up |
gpu_cache_usage_perc |
Latency-sensitive workloads | KV cache filling up (proactive) |
Yes, the metric is called gpu_cache_usage_perc even on
TPU. It measures the KV cache, not anything GPU-specific. Another
naming gift from the ecosystem.
I chose num_requests_waiting with a threshold of 5 for
this deployment:
apiVersion: autoscaling/v2
kind: HorizontalPodAutoscaler
metadata:
  name: vllm-hpa
spec:
  scaleTargetRef:
    apiVersion: apps/v1
    kind: Deployment
    name: vllm-tpu
  minReplicas: 1
  maxReplicas: 2
  metrics:
  - type: Pods
    pods:
      metric:
        name: prometheus.googleapis.com|vllm:num_requests_waiting|gauge
      target:
        type: AverageValue
        averageValue: 5
View full manifest: k8s/hpa.yaml
# HorizontalPodAutoscaler for vLLM on TPU
#
# Scales based on vLLM's num_requests_waiting metric, which reflects
# the number of requests queued in the server. When the KV cache fills
# up, this metric climbs and triggers a scale-out.
#
# For latency-sensitive workloads, swap to gpu_cache_usage_perc instead.
apiVersion: autoscaling/v2
kind: HorizontalPodAutoscaler
metadata:
  name: vllm-hpa
  namespace: vllm
spec:
  scaleTargetRef:
    apiVersion: apps/v1
    kind: Deployment
    name: vllm-tpu
  minReplicas: 1
  maxReplicas: 2
  metrics:
  - type: Pods
    pods:
      metric:
        name: prometheus.googleapis.com|vllm:num_requests_waiting|gauge
      target:
        type: AverageValue
        # Low threshold for demo purposes so autoscaling triggers quickly.
        # In production, profile your workload to find the right value.
        averageValue: 5
  behavior:
    scaleUp:
      stabilizationWindowSeconds: 30
      policies:
      - type: Pods
        value: 1
        periodSeconds: 60
    scaleDown:
      stabilizationWindowSeconds: 300
      policies:
      - type: Pods
        value: 1
        periodSeconds: 120
The end-to-end autoscaling chain
When everything is wired up, the signal flows like this: incoming load
increases, vLLM's request queue grows, Managed Prometheus scrapes the
num_requests_waiting metric every 15 seconds, Cloud
Monitoring ingests it, the Custom Metrics Adapter exposes it to the
Kubernetes API, HPA reads the metric and decides to scale to 2
replicas, Kubernetes schedules a second vLLM pod, the pod lands in
Pending state because there's no available TPU node, the node pool
autoscaler provisions a new TPU node, and the pod starts loading the
model from the GCS cache. Within a few minutes, the second replica is
Ready and serving requests.
Scale-down reverses the process: about 5 minutes of HPA cooldown, then 10-15 minutes before the idle TPU node is removed by the node pool autoscaler.
Live HPA output from the deployment
NAME       REFERENCE             TARGETS   MINPODS   MAXPODS   REPLICAS   AGE
vllm-hpa   Deployment/vllm-tpu   0/5       1         2         1          6m
num_requests_waiting metric: 0
waiting requests against a threshold of 5, with 1 active replica.
The HPA was reading the metric correctly: 0/5 means 0
waiting requests against a threshold of 5. With
GPUS_ALL_REGIONS=1, the node pool max is 1, so
autoscaling to a second TPU node would require more quota. But the
entire signal chain is proven and working. When more quota arrives, I
just change maxReplicas and the node pool's
--max-nodes.
View load testing script: scripts/load-test.sh
#!/usr/bin/env bash
#
# load-test.sh -- Generates parallel requests against the vLLM endpoint
# to demonstrate HPA autoscaling on GKE TPU.
#
# Usage:
#   ./scripts/load-test.sh            # 20 parallel workers (default)
#   ./scripts/load-test.sh 50         # 50 parallel workers
#   ./scripts/load-test.sh 50 stop    # kill background load generators
#
set -euo pipefail

NAMESPACE="${NAMESPACE:-vllm}"
N="${1:-20}"
ACTION="${2:-start}"

if [[ "$ACTION" == "stop" ]]; then
  echo "Stopping all background load generators..."
  pkill -f "load-test-worker" 2>/dev/null || true
  echo "Done."
  exit 0
fi

VLLM_IP=$(kubectl get service vllm-service -n "$NAMESPACE" \
  -o jsonpath='{.status.loadBalancer.ingress[0].ip}' 2>/dev/null)

if [[ -z "$VLLM_IP" ]]; then
  echo "ERROR: Could not get vllm-service external IP. Is the service running?"
  exit 1
fi

MODEL="${MODEL:-google/gemma-3-4b-it}"

echo "=== vLLM Load Test ==="
echo "  Endpoint:  http://$VLLM_IP:8000"
echo "  Model:     $MODEL"
echo "  Workers:   $N"
echo ""
echo "Press Ctrl+C to stop, or run: $0 0 stop"
echo ""

for i in $(seq 1 "$N"); do
  (
    while true; do
      curl -s --max-time 120 \
        "http://$VLLM_IP:8000/v1/completions" \
        -H "Content-Type: application/json" \
        -d "{
          \"model\": \"$MODEL\",
          \"prompt\": \"Write a comprehensive essay about the history of artificial intelligence, covering its origins, key milestones, and future directions.\",
          \"max_tokens\": 500,
          \"temperature\": 0.7
        }" > /dev/null 2>&1
    done
  ) &
done

echo "Load test running with $N workers (PIDs in background)."
echo "Monitor autoscaling with:  kubectl get hpa -n $NAMESPACE --watch"
wait
9. Operational Notes
These are the things that didn't fit neatly into other sections but will save you time if you know them going in.
XLA cache conflicts on scale-up
When two vLLM pods write the XLA compilation cache to the same GCS path simultaneously, you get:
RuntimeError: filesystem error: cannot create directories
Two options: remove the VLLM_XLA_CACHE_PATH environment
variable entirely (each pod recompiles from scratch, slower startup),
or scale to 1 first, wait for the cache write to finish, then scale to
2+. I'd recommend the second approach for production.
Readiness and liveness probe tuning
Model loading takes minutes, not seconds. I set the readiness probe's
initialDelaySeconds to 120 and the liveness probe's to
300. For a 4B model on a single chip, the pod went Ready about 6
minutes after creation. For larger models, increase these further.
readinessProbe:
  initialDelaySeconds: 120    # 2 min for small models
  periodSeconds: 10
livenessProbe:
  initialDelaySeconds: 300    # 5 min before killing
  periodSeconds: 30
If the liveness probe fires before the model finishes loading, Kubernetes kills the pod and restarts it. This creates a crash loop that looks like a model loading failure but is actually a probe timing issue.
MIG status monitoring
When a TPU node is stuck provisioning,
kubectl get nodes shows nothing because the node doesn't
exist yet. To see what's actually happening at the infrastructure
layer, check the managed instance group:
gcloud compute instance-groups managed describe \
  $(gcloud compute instance-groups managed list --project=YOUR_PROJECT \
    --zones=us-central1-a --format="value(name)" | grep tpu) \
  --zone=us-central1-a --project=YOUR_PROJECT \
  --format="yaml(status,currentActions)"
This shows creating: N, pending: N, and
similar status information. Much more informative than staring at an
empty node list.
Addon enable ordering
To reiterate: Workload Identity must be enabled before GCS FUSE. They can't be combined into one update command. Two sequential updates, 15 minutes each. Enable both at cluster creation to avoid this entirely.
--tpu-topology inconsistency
The --tpu-topology flag behaves differently across zones
for single-host types. I found that
us-central1-a accepted it for
ct5lp-hightpu-4t, but us-east5-a rejected
the same command. For single-host types, omit
--tpu-topology entirely. For multi-host types (16t+),
it's required.
10. Lessons Learned
The hardest part of this project was not the code, the YAML, or the architecture. It was getting a single chip of TPU quota. The entire deployment - from cluster creation to a live, autoscaling inference endpoint - took about 20 minutes once quota was sorted. The preceding 6 hours were spent fighting quota and capacity.
I'd recommend starting on the smallest possible hardware and proving
the full stack end to end before scaling up. I deployed the entire
autoscaling infrastructure on a single TPU chip serving a 4B model.
When more quota arrives, I change four values: machine type (ct5lp-hightpu-1t
to ct5lp-hightpu-8t), topology label (1x1 to
2x4), TPU count (1 to 8), and tensor parallel size (1 to
8). Everything else - GCS FUSE, Workload Identity, PodMonitoring, HPA,
the load testing scripts - stays exactly the same.
TPU quota beyond 1 chip requires Google Cloud Sales engagement. The self-service quota request system will redirect you. This isn't a bug - it's how TPU allocation works for projects without an existing sales relationship. Budget time for this conversation, especially if you're on a deadline.
Capacity errors and quota errors look similar but demand different
responses. Capacity errors auto-retry: create the node pool and let
GKE handle it. Quota errors are permanent until you manually request
an increase. I wasted hours zone-hopping for capacity when the real
blocker was GPUS_ALL_REGIONS=0 all along, hidden behind
capacity errors that fired first.
Build around the constraint, not against it. When I got
GPUS_ALL_REGIONS=1 instead of the 16 I'd asked for, I
could have stopped. Instead, I scoped the deployment to fit the
constraint: a single chip, a smaller model, and the same autoscaling
architecture that will work at full scale. The constraint shaped the
deployment, but it didn't block the learning.
The naming is misleading everywhere, and this is worth internalizing
before you start. GPUS_ALL_REGIONS blocks TPUs, not just
GPUs. The --accelerator flag in GKE is for GPUs; TPUs use
--machine-type. TPU_LITE_DEVICE_V5 and
TPU_LITE_PODSLICE_V5 are different quotas for different
chip counts. gpu_cache_usage_perc in vLLM works on TPUs
too - it measures the KV cache, and the name is an artifact from when
vLLM only supported GPUs. Once you accept that the names are lies, you
can work with the system rather than being confused by it.
11. Repository and Teardown
The full code, manifests, and scripts are at github.com/xprilion/gemma3-vllm-tpu-gke-autoscaling.
File tree
Teardown
The included teardown script removes everything in order: Kubernetes namespace, Custom Metrics Adapter, GCS bucket, TPU node pool, and the GKE cluster itself.
# Option 1: Use the included script
./scripts/teardown.sh

# Option 2: Manual
kubectl delete namespace vllm
kubectl delete -f https://raw.githubusercontent.com/GoogleCloudPlatform/k8s-stackdriver/master/custom-metrics-stackdriver-adapter/deploy/production/adapter_new_resource_model.yaml
gcloud storage rm --recursive gs://vllm-tpu-benchmark-model-cache
gcloud container clusters delete tpu-cluster \
  --zone=us-central1-a --project=vllm-tpu-benchmark --quiet
View full script: scripts/teardown.sh
#!/usr/bin/env bash
#
# teardown.sh -- Removes all resources created by this demo.
#
# Usage:
#   ./scripts/teardown.sh           # interactive confirmation
#   ./scripts/teardown.sh --force   # skip confirmation
#
set -euo pipefail

PROJECT="${PROJECT:-vllm-tpu-benchmark}"
ZONE="${ZONE:-us-central1-a}"
CLUSTER="${CLUSTER:-tpu-cluster}"
NAMESPACE="${NAMESPACE:-vllm}"
BUCKET="${BUCKET:-vllm-tpu-benchmark-model-cache}"
FORCE=false

[[ "${1:-}" == "--force" ]] && FORCE=true

RED='\033[0;31m'
BOLD='\033[1m'
NC='\033[0m'

echo -e "${BOLD}=== Teardown: vLLM TPU Autoscaling Demo ===${NC}"
echo ""
echo "  Project:   $PROJECT"
echo "  Zone:      $ZONE"
echo "  Cluster:   $CLUSTER"
echo "  Namespace: $NAMESPACE"
echo "  Bucket:    gs://$BUCKET"
echo ""

if [[ "$FORCE" != true ]]; then
  read -r -p "This will DELETE everything listed above. Proceed? [y/N] " confirm
  if [[ "$confirm" != [yY] ]]; then
    echo "Aborted."
    exit 0
  fi
fi

echo ""

echo "[1/5] Deleting Kubernetes resources in namespace '$NAMESPACE'..."
kubectl delete namespace "$NAMESPACE" --ignore-not-found 2>&1 || true

echo "[2/5] Deleting Custom Metrics Adapter..."
kubectl delete -f https://raw.githubusercontent.com/GoogleCloudPlatform/k8s-stackdriver/master/custom-metrics-stackdriver-adapter/deploy/production/adapter_new_resource_model.yaml 2>&1 || true

echo "[3/5] Deleting GCS bucket gs://$BUCKET..."
gcloud storage rm --recursive "gs://$BUCKET" --project="$PROJECT" 2>&1 || true

echo "[4/5] Deleting TPU node pool..."
gcloud container node-pools delete tpu-v5e-pool \
  --cluster="$CLUSTER" --zone="$ZONE" --project="$PROJECT" --quiet 2>&1 || true

echo "[5/5] Deleting GKE cluster..."
gcloud container clusters delete "$CLUSTER" \
  --zone="$ZONE" --project="$PROJECT" --quiet 2>&1 || true

echo ""
echo -e "${BOLD}Teardown complete.${NC}"
What to change for 8-chip scaling
When more GPUS_ALL_REGIONS quota arrives, the changes are
minimal:
-
Node pool machine type:
ct5lp-hightpu-1ttoct5lp-hightpu-8t -
Deployment nodeSelector topology:
1x1to2x4 -
Deployment TPU resource limit:
1to8 -
vLLM
--tensor-parallel-size:1to8 -
Model:
google/gemma-3-4b-ittogoogle/gemma-4-26B-A4B-it(once vLLM TPU adds support) orgoogle/gemma-3-27b-it(works today)
Everything else - GCS FUSE, Workload Identity, PodMonitoring, HPA, load testing - stays identical.